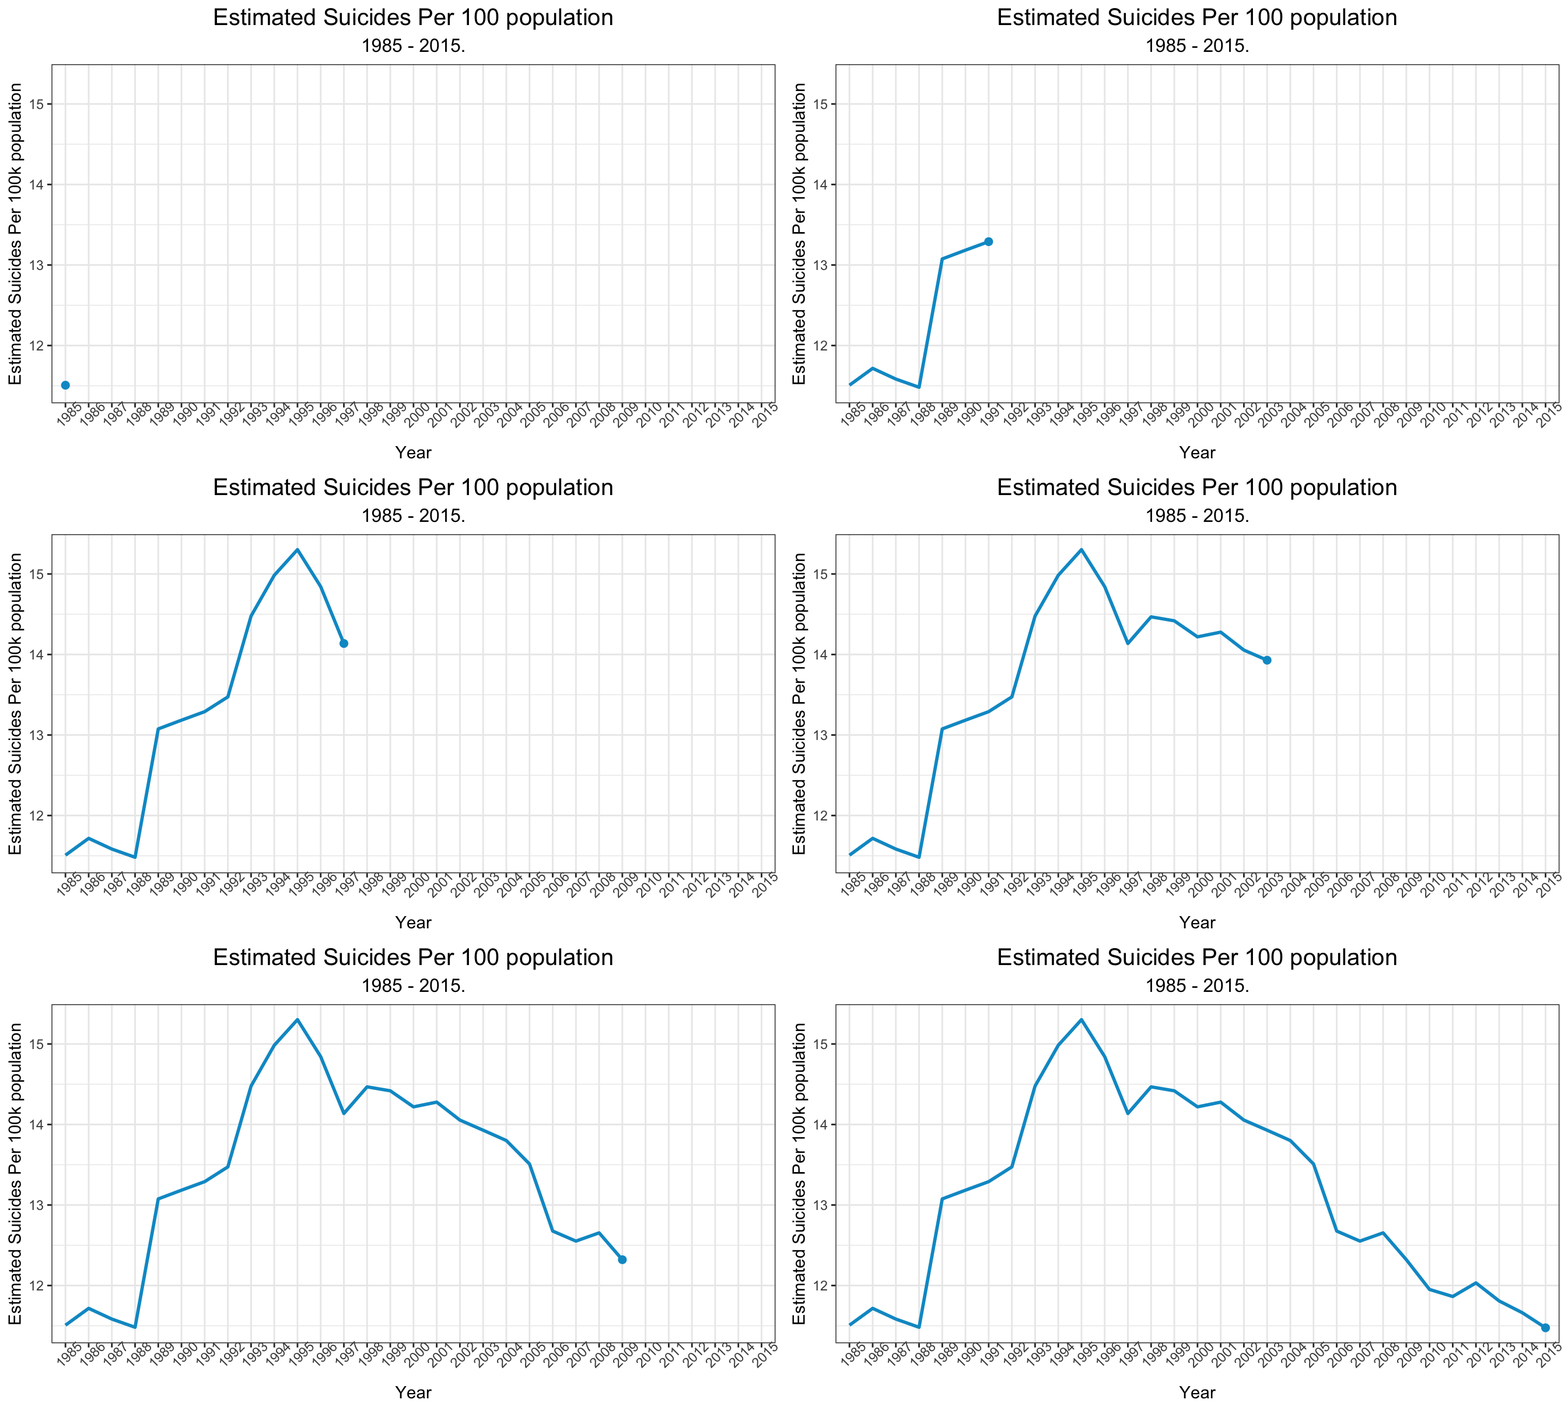
Global Trend of Suicide Per 100k Population over time
We first plot the estimated total suicides per 100k population across all countries throughout the time. As we can see, in recent years, the estimated suicides are decreasing.
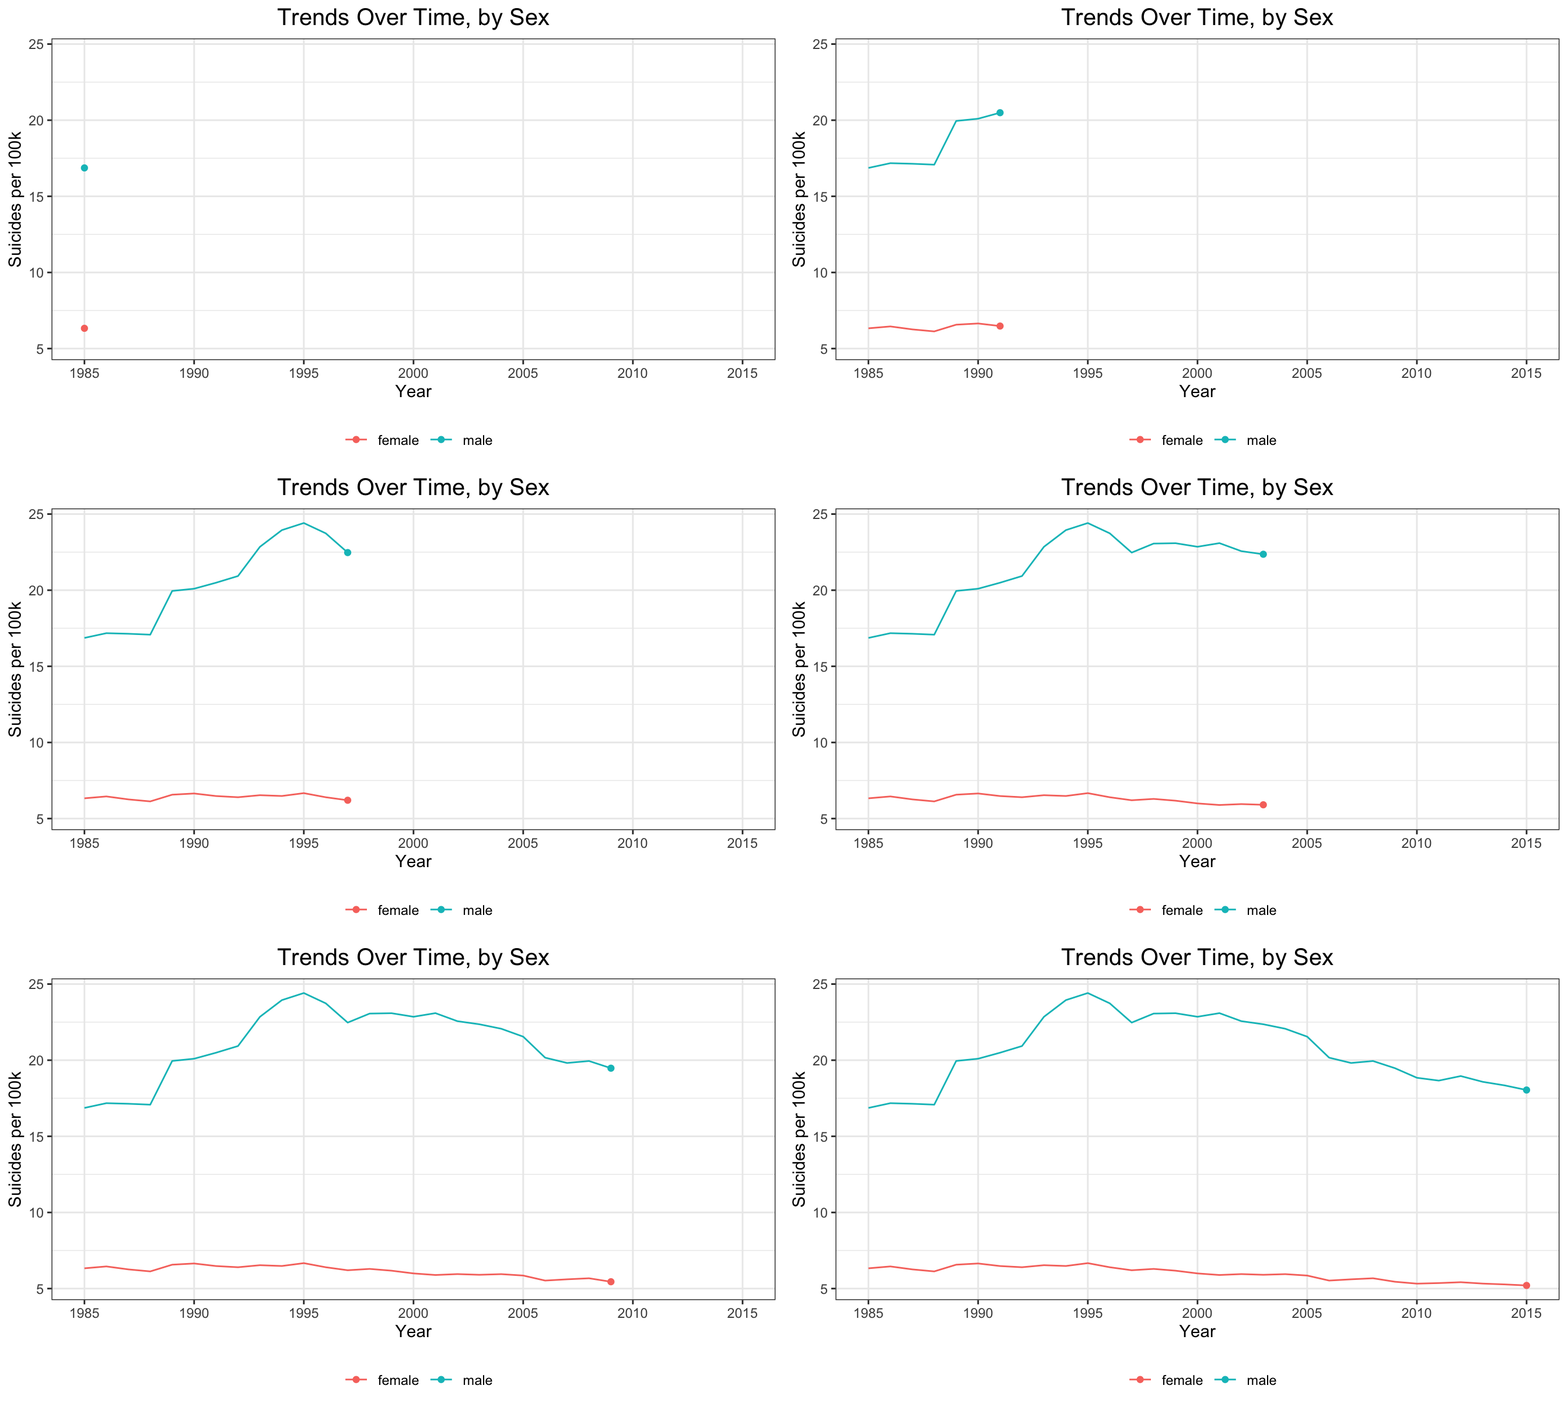
Global Trend of Suicide Per 100k Population by gender over time
We found that surprisingly, male has higher rate of suicide than female since 1985. Female suicide rate had a very stable trend throughout the history, while the male suicide rate had dramatic changes. As mentioned in the other graph, there is a peak in 1995 for the suicide rate.
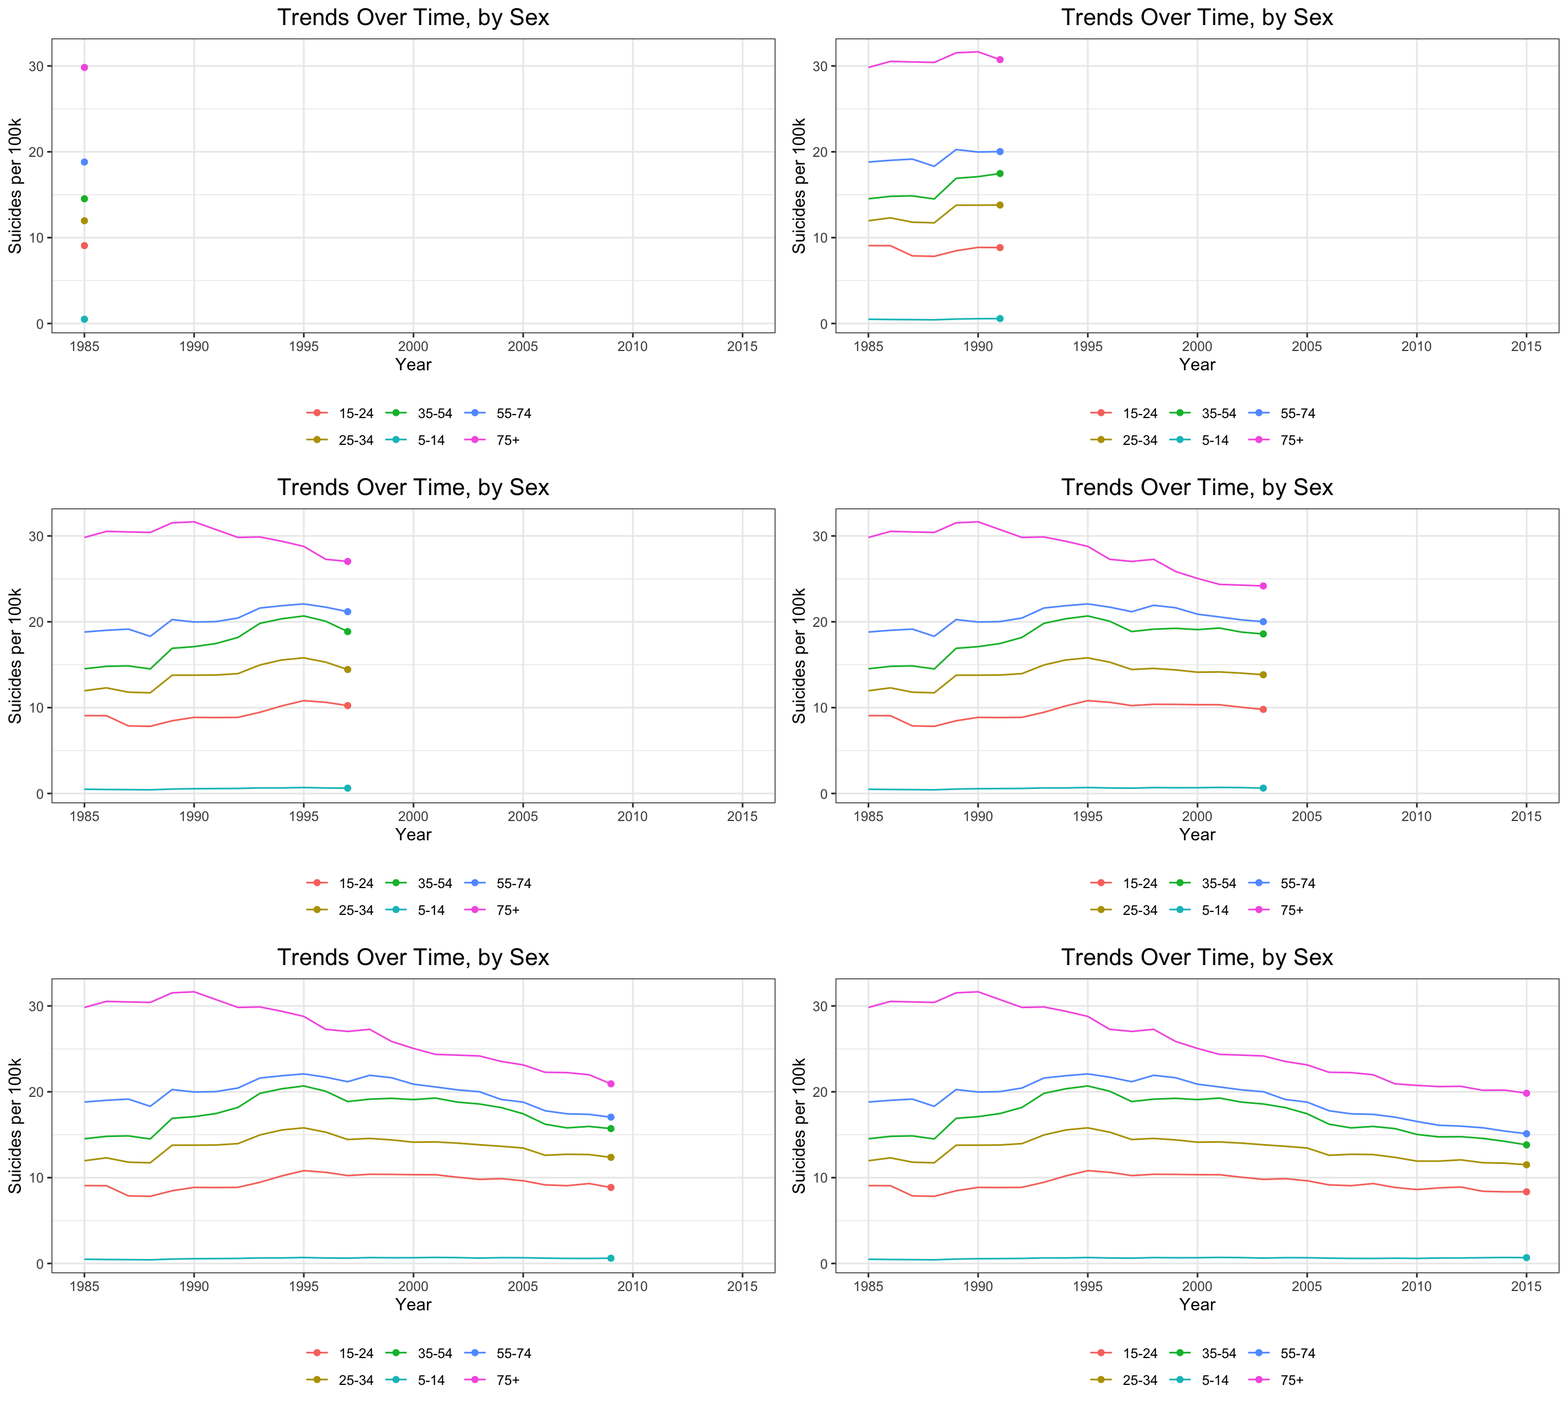
Global Trend of Suicide Per 100k Population by age over time
Suicide rates for the youngest age group are nearly constant and low over time. As the graph shown, elder groups had higher suicide rate since 1985, and surprisingly such trend has not changed once. Age groups 25-34, 35-54 and 55-74 had similar trends over those 30 years.
Suicide Rate by Country GDP
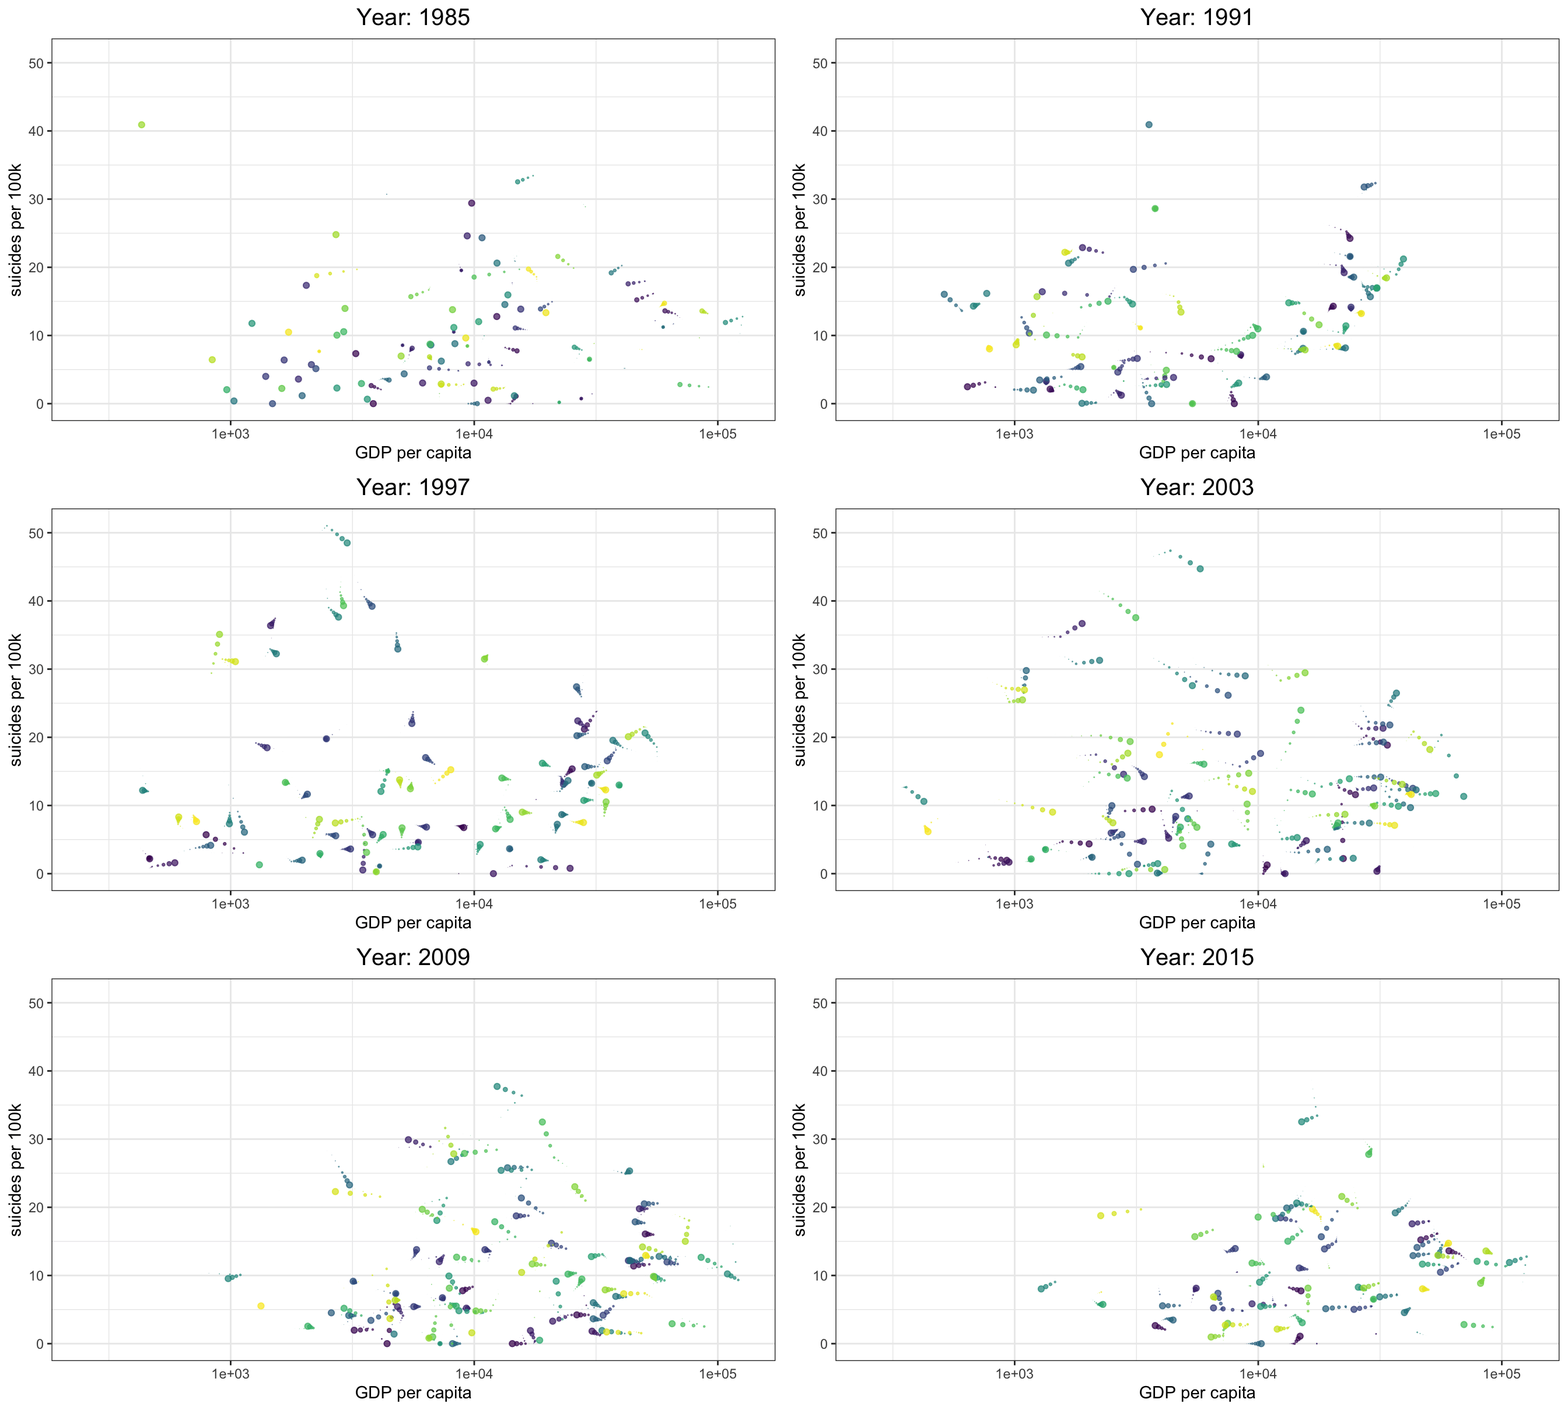
GDP has been viewed as a good measure about the development of a country. However, the graph below shows that there is no obvious trend between GDP and suicide rate. Each color represents one country and from the animation of the plot, we can see that although GDP’s across the world have been shifted toward the right which indicates an increasing trend, the estimated suicide in 100k people does not change that much.
Countries with most suicides across the years
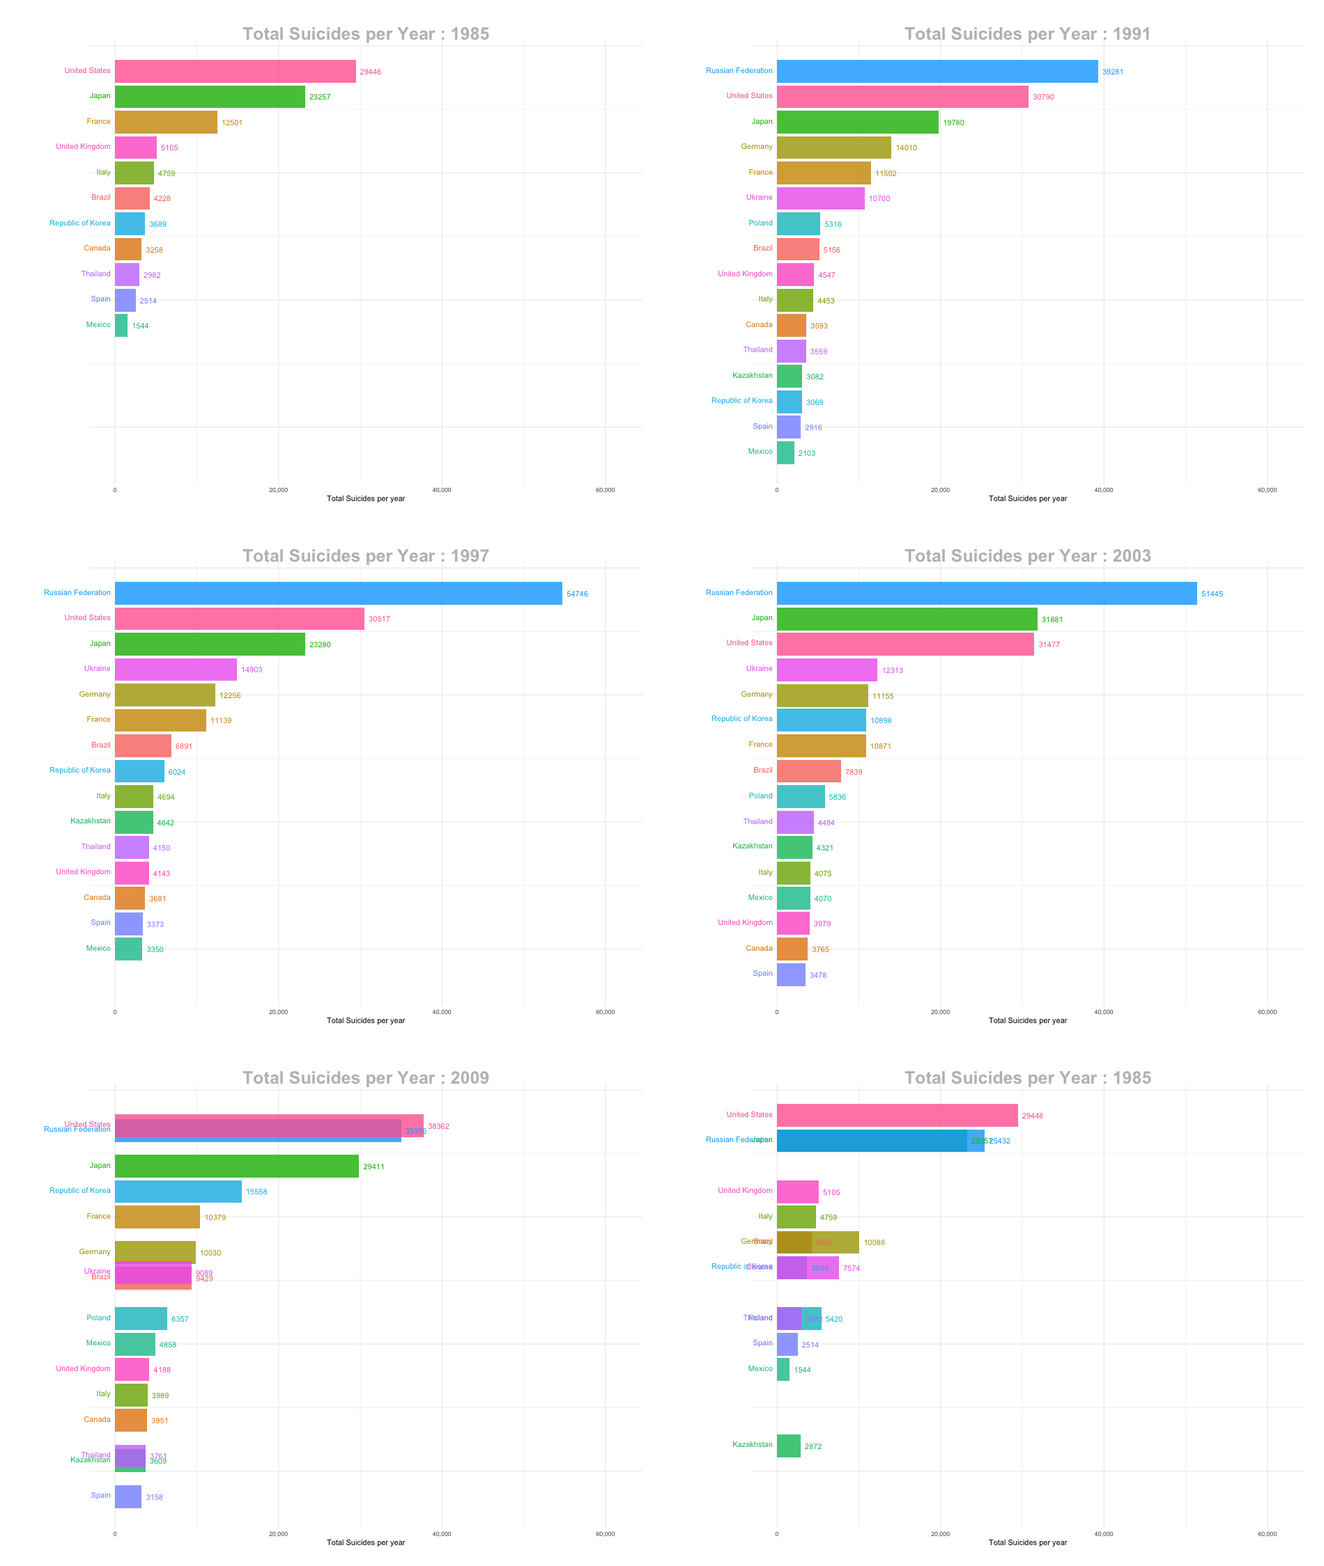
We are also interested about the ranking of amount of suicides across the time. Below, we show the changes of the ranking across time. Since there are too many countries, we will choose the top 20 countries with largest total number of suicides from 1985 to 2015. Each of them has more than 10k death due to suicide across this 30-year period. Those countries are:
| country | count |
|---|---|
| Russian Federation | 1209742 |
| United States | 1034013 |
| Japan | 806902 |
| France | 329127 |
| Ukraine | 319950 |
| Germany | 291262 |
| Republic of Korea | 261730 |
| Brazil | 226613 |
| Poland | 139098 |
| United Kingdom | 136805 |
| Italy | 132060 |
| Mexico | 111139 |
| Canada | 107561 |
| Thailand | 106526 |
| Kazakhstan | 101546 |
| Spain | 100202 |
